Mario Zavala
A genogram is a pictorial representation of a family across several generations. While similar to a family tree, a genogram goes one step further, mapping out relationships and traits to help identify hereditary patterns and psychological factors that influence behavior. Genograms are commonly used in the fields of medicine, psychology, social work, genealogy, genetic research and education. If you want to know how to draw a genogram, the process simply involves a little research and knowledge of the basic genogram symbols.
Preparing the Genogram
Mario Zavala
Determine the purpose of your genogram and decide how many generations you want to depict. You might opt to focus simply on familial relationships, or take it a step further and add detail on medical histories or other hereditary patterns.
Mario Zavala
Conduct some background research to get all of the information you need. Refer to a family tree for names and dates, or interview family members to fill in the missing details.
Mario Zavala
Gather all of your notes and materials together, either physically in a folder or electronically on a spreadsheet.
The Basic Layout
Mario Zavala/Demand Media
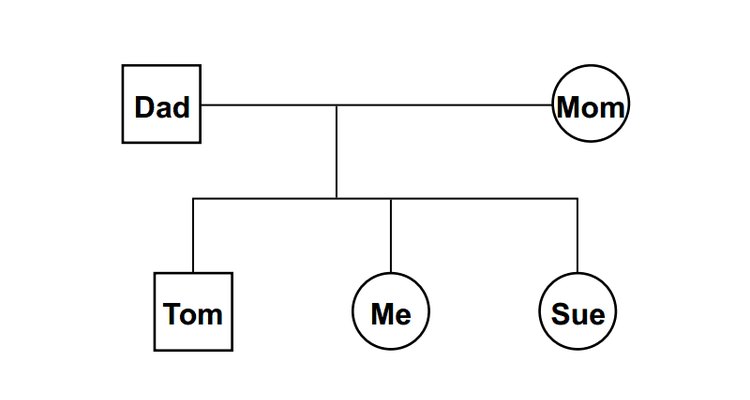
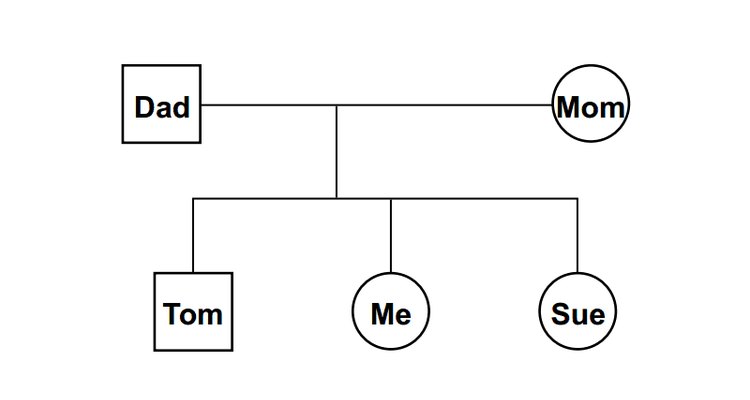
Create a basic genogram template by starting with yourself and your immediate family members, including your parents and siblings.
Mario Zavala/Demand Media
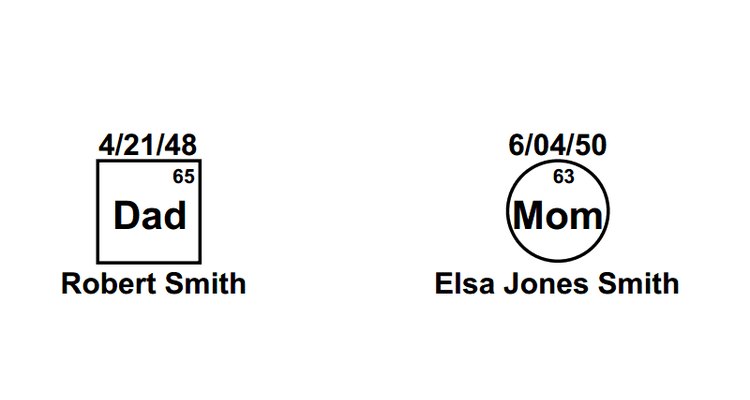
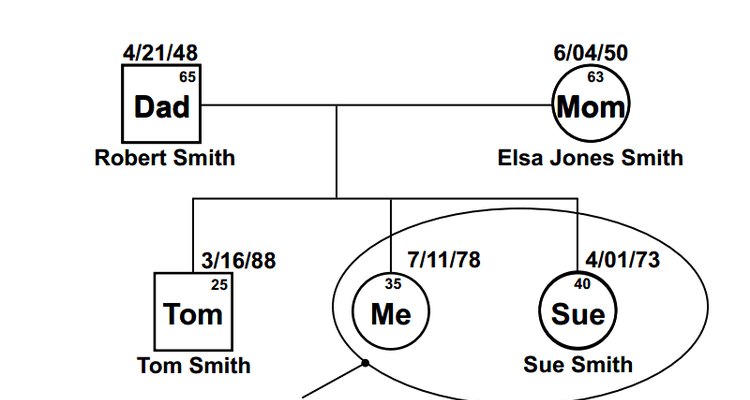
Use symbols to denote gender (male=square, female=circle), and have the date of birth (and date of death if applicable) above and the individual's name below. Indicate their current age inside of the symbol.
Mario Zavala/Demand Media
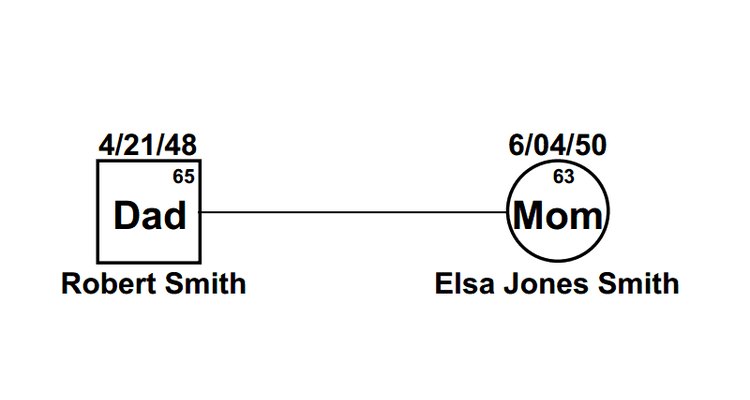
Denote partnered parents with a solid connecting line, with the father on the left, mother on the right.
Mario Zavala/Demand Media
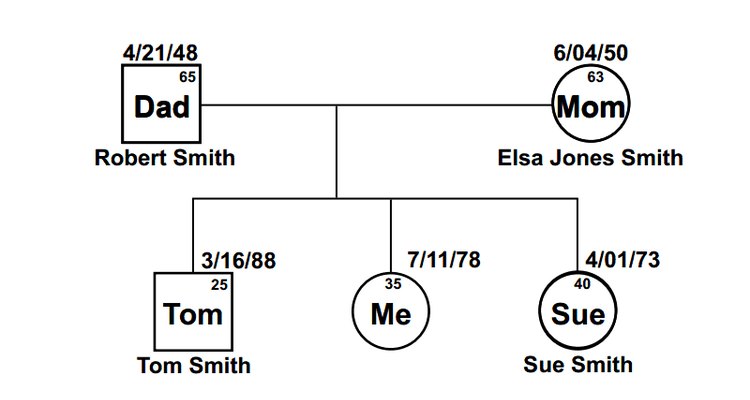
List children youngest to oldest, left to right. In this illustration, for example, Tom would be the youngest of the siblings, you ("Me") would be the middle child and Sue would be the oldest.
Mario Zavala/Demand Media
Add on extended family members as desired. Draw a shape around members of a shared household.
Adding Detail
Mario Zavala/Demand Media
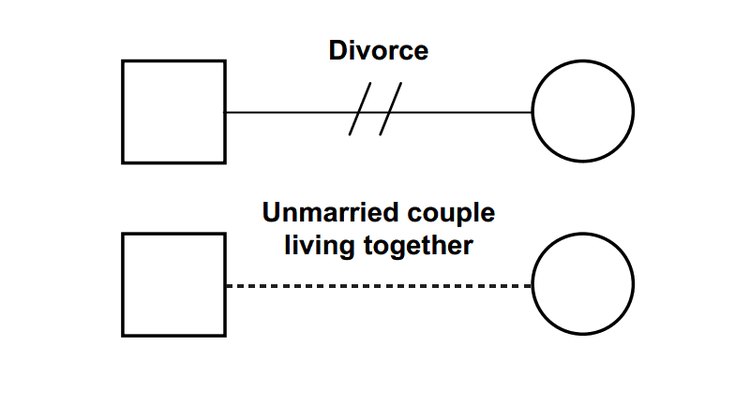
Use color-coded lines to define family relationships (i.e. dotted line to show an unmarried couple living together; divorce with a solid line with two slashes through it).
Mario Zavala/Demand Media
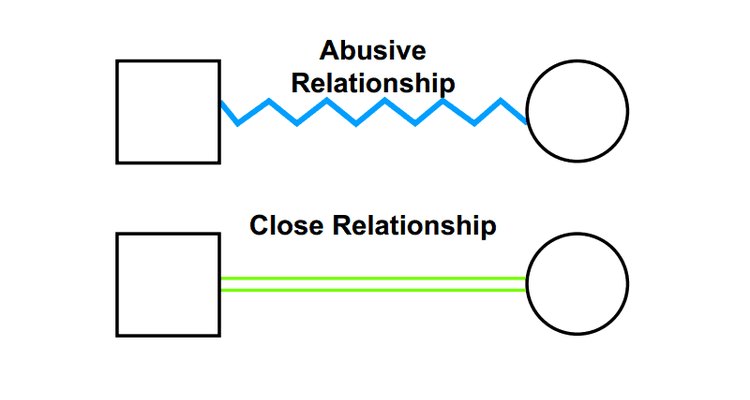
Use color-coded lines to define emotional relationships (i.e. abuse is shown with a jagged blue line, two people who are very close linked by two, straight, green lines).
Mario Zavala/Demand Media
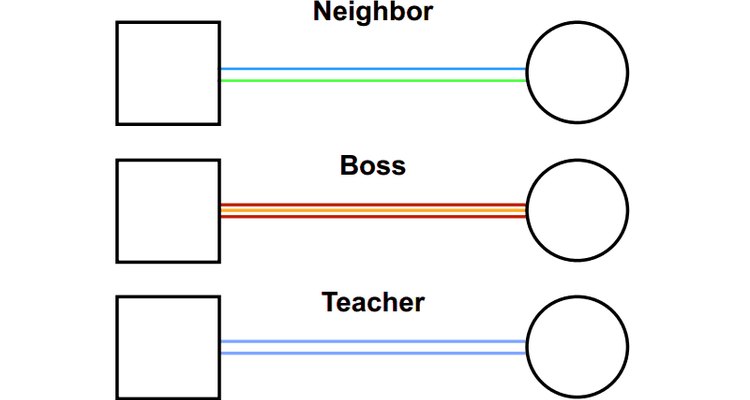
Use color-coded lines to define social relationships (neighbor, boss, teacher etc.).
Related Articles

How to Construct a Kinship Diagram

How to Make a Genogram Chart

What Are the Genogram Symbols?

How to Do a Genogram

How to Make a Free Genogram
How to Draw a Family Tree When There Is ...

Genograms & Ecomaps
Family Tree Rules

How to Create a Family Tree That ...

How to Make a Family Tree With Ex ...
How to Make a Family Tree for the 5th ...

How to Address an Envelope With ...

How to Remove Hem Marks

The Effects of Lack of Communication in ...

How to Find Twins on Pedigree Charts

How to Repair Broken Family Ties

The Difference Between First and Second ...

Traditional Gifts for a 40th Wedding ...

What Is a First-Degree Relative?

How to Create a Family Shield
References
Resources
Tips
- There are quite a few variations on genogram symbols, so once you have chosen a symbol, be consistent throughout your genogram with it.
- There is no limit to the type of data that can be included in a genogram, so feel free to interpret it for your own use.
- If you want a more structured template, there are specifically designed computer programs for creating genograms, that can usually be downloaded for a fee.
Writer Bio
Lynn Holmgren is a freelance writer based in York, Penn. She has published articles about writing, international exchange, travel and outdoor recreation in ShowcasePA! magazine and Bootsnall.com. Homgren also enjoys writing and reviewing short stories on her blog Long Story Short.
Photo Credits
Mario Zavala